
Read an air quality index and its limits
Identify the place, day, scale and pollutants behind an index. Distinguish background air quality, personal exposure and annual trends.
Follow the method ↓
The answer in 30 seconds
Two applications can display different colours for the same place while using different indicators. Record the scale, day and producer before comparing them. A colour alone establishes neither a precise concentration nor personal exposure.
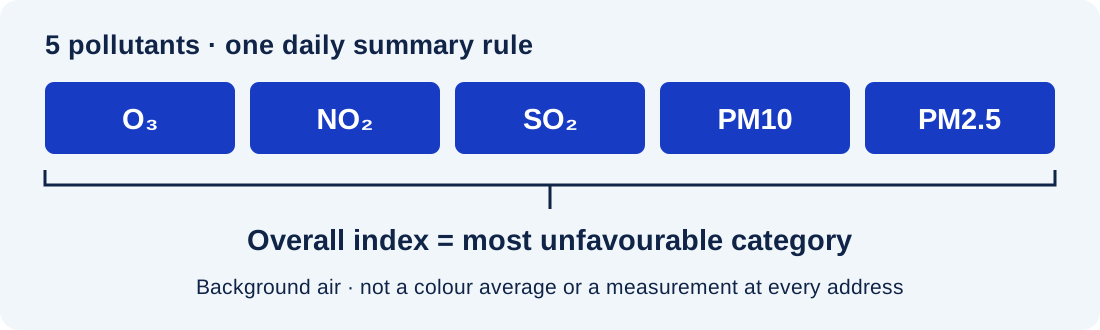
France’s ATMO index summarises daily background air quality using ozone, nitrogen dioxide, sulphur dioxide, PM10 and PM2.5. The most unfavourable pollutant category determines the overall index. It is not an average of the colours, a measurement at every address or an annual trend.
Examples to adapt
Check whether the maps use the same index, thresholds and forecast period.
A background index cannot determine exposure along every part of the route.
Use annual series and their method rather than today’s colour.
Follow the method
- 1Identify the map and date
Record the producer, area, day and update time. Distinguish observations from forecasts. A shared screenshot may describe a previous day.
- 2Read the definition
Open the legend and method. Record pollutants and thresholds before comparing another application. Different named scales cannot automatically be compared.
- 3Inspect the determining pollutant
Read available sub-indices and details. The overall result does not imply that every pollutant has the same level. Do not average qualitative categories.
- 4Respect the geographic scale
Background air quality does not represent every street or indoor environment. Consult the regional association and documentation for relevant stations or models.
- 5Keep a defensible conclusion
Record place, day, indicator, source, observed or forecast status and the main limit. Use annual series and reports to examine long-term trends.
A checklist to keep
Use these checks to record your observations. They are a reading aid, not an automatic assessment.
| Check | What to examine | Action |
|---|---|---|
| Place and time | Area, date, period | Match the scope |
| Method | Index, thresholds, pollutants | Read the legend |
| Status | Observed or forecast | Qualify the result |
| Limit | Background, street, indoors | Avoid extrapolation |
Free, no sign-up. UTF-8 text with semicolon-separated columns.
What to check
An index without a date or legend cannot support a meaningful comparison.
ATMO does not cover pollen, indoor air or every pollutant.
Missing data do not indicate good air quality.
Individual health advice belongs with appropriate authorities and professionals.
Common questions
Can I average colour categories?
No. They are categories defined by thresholds. Use the producer’s method and suitable measurements for aggregation.
Does the index describe air inside my home?
No. It concerns background outdoor air across an area. Indoor air has other sources and conditions.
Does one good day establish an annual improvement?
No. Compare equivalent periods using documented units, coverage and methods.
Sources and documentation
Documentation consulted on . Examples are illustrative; interfaces and results may change.
Reference record for this resource
Identify the publisher, official destination and practical checks before using the service.
Read the Atmo France record →